
WHAT IS EMPLOYEE TURNOVER
Employee turnover is, simply put, when you lose an employee you don’t want to lose. When someone who is valuable to your company decides to leave even though you want to keep them. We are not referring here to people you fire or dismiss, but rather people you really want to keep.
There have now been over 1500 published, academic peer-reviewed studies conducted over the past 2 decades on employee turnover (Source 3). It remains one of the most widely investigated topics in industrial psychology and management research.
Why?
Because it is such a persistent problem with such large business and societal costs. Annual turnover in just the US hourly worker space costs businesses over $110 Billion each year. According to iCIMS U.S. 2015 Hiring Trends Report, the average time to fill was 44 calendar days, and because of this:
“Not only does the organization lose a valued employee and their knowledge, but there’s a timeframe where the business has no one doing the work. Or they have employees temporarily handling the work.” Source 4
And organizations with high turnover tend to have correspondingly low employee engagement which is a well-documented productivity and culture killer.
HOW WIDESPREAD IS EMPLOYEE TURNOVER
Employee turnover varies widely depending on the job type, geographic region and type of job. We have read dozens of studies on turnover, and had many engagements with companies ranging from small business to fortune 500’s. Nearly all organizations view involuntary turnover as a significant problem. Interestingly, most face a similar pattern where they have very high turnover in the first 30 days, and then it remains high (but slows) until people pass some mark. This could be six to twelve months – but once past this mark, turnover tends to fall significantly.
A primary goal of employee selection therefore becomes finding those people who can make it past that ‘if-they-make-it-pass-this-time-they-are-likely-to-stick-around’ period.
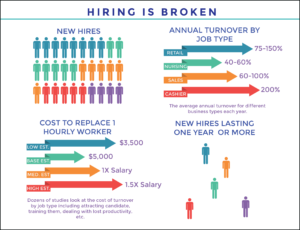
Here is a chart showing some representative turnover rates and costs:
WHAT CAUSES INVOLUNTARY TURNOVER
From reviewing the academic literature and popular articles, there are three main causes of employee turnover:
- Poor fit. This has 4 primary sub-dimensions
- Poor fit between the person’s skills and the job demands.
- Specifically, a lack of skills or inability to ‘do’ the job based on a mismatch between the skills the person possesses and those the job demands.
- Poor fit between the person and the working schedule.
- This can take the form of either a job that demands working too many or too few hours, or not having the hours or days available the person most desires / needs.
- Poor fit between the person and the manager / co-workers.
- This can be communication style, management style, personality mismatches or a misalignment around the working styles and/or other forms of personal interaction. Multiple research papers and large scale studies point to the relationship with the boss as being among the most important factors.
- Turnover on ‘high engagement’ teams was 24% less for highly engaged workers in high-turnover organizations and 59% less in low turnover organizations. (Source 5).
- Employees who worked for a female manager were 6% more engaged (Source 1).
- Turnover on ‘high engagement’ teams was 24% less for highly engaged workers in high-turnover organizations and 59% less in low turnover organizations. (Source 5).
- This can be communication style, management style, personality mismatches or a misalignment around the working styles and/or other forms of personal interaction. Multiple research papers and large scale studies point to the relationship with the boss as being among the most important factors.
- Poor fit between the person and the company’s dominant values and culture.
- This is growing in importance, and is sighted more by millennials than prior generations.
- For example, 39% of women and 33% of men say that the reputation of the company or brand is extremely important for whether they will be at the company in 2 years (Source 1).
- This is growing in importance, and is sighted more by millennials than prior generations.
- Poor fit between the person’s skills and the job demands.
- Insufficient Compensation or Benefits / a ‘better’ or higher paying opportunity elsewhere.
- 84% of employees with high-benefit satisfaction report high job satisfaction (Source 1).
- 57% of millennials say they would leave a job with poor work-life balance (Source 6).
- Nearly 80% of millennial workers surveyed would prefer more benefits to more pay (Source 1).
- 60% of women and 48% of men rate ‘better work-life balance’ and ‘better health’ as very important (Source 1).
- Boredom & Lack of personal challenge / growth / development / advancement opportunities.
- This results in boredom – often stemming from insufficient opportunities for leadership development and/or poor job-person fit or a job that isn’t sufficiently challenging (or is too challenging) for the worker given their interests, skills and abilities.
- 71% of millennials likely to leave their company in the next 2 years are unhappy with how their leadership skills are being developed (Source 1).
- This results in boredom – often stemming from insufficient opportunities for leadership development and/or poor job-person fit or a job that isn’t sufficiently challenging (or is too challenging) for the worker given their interests, skills and abilities.
Understanding what is driving your employee turnover is critical to reducing and eliminating it. In terms of how to understand this, the best methods are generally a combination of ‘human’ skills – walking around and talking to your people – and more ‘systematic methods’ of data collections such as a) anonymous, semi-regular culture pulse surveys, b) exit surveys and interviews with people thriving in, and leaving your company, and c) quantitative survey and interview based talent analytics on top and bottom performers combined with thorough job analysis.
However, all of these activities should produce meaningful impacts on the company, impacts employees can see – and that are communicated openly and regularly to them. Employees have to be part of any efforts if it they are to succeed.
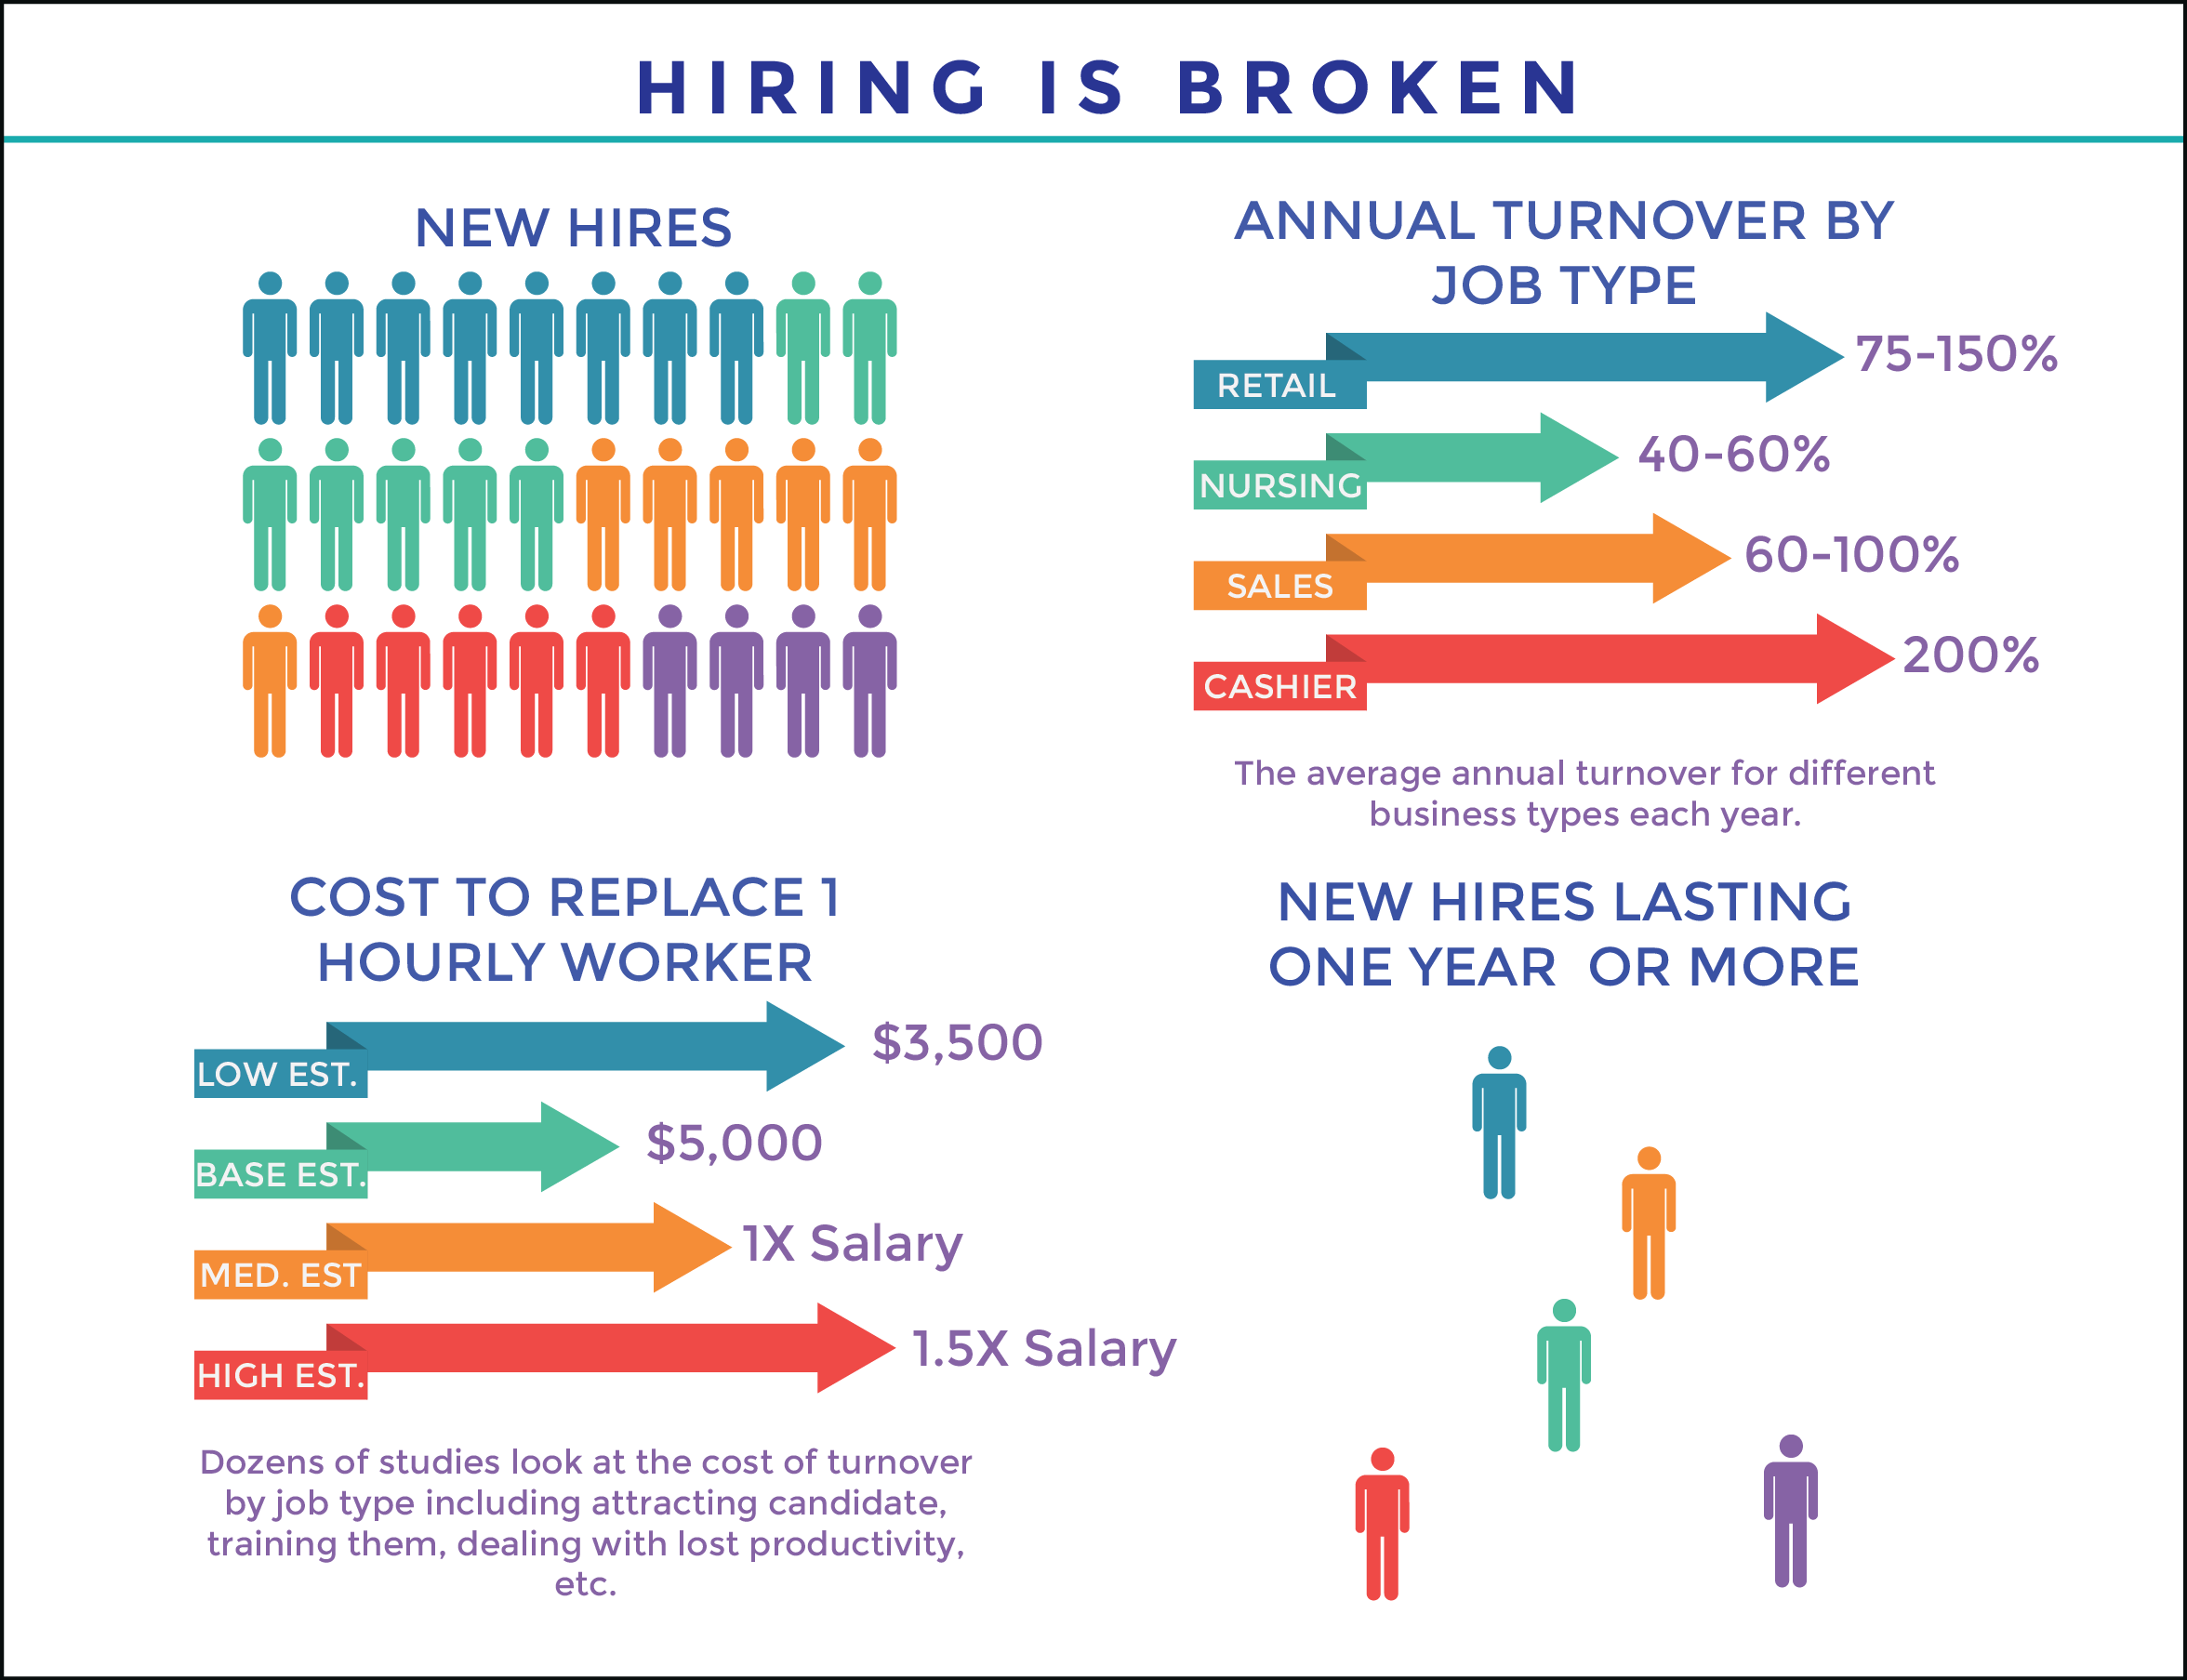
A JOB STUDY – SAMPLE RESULTS
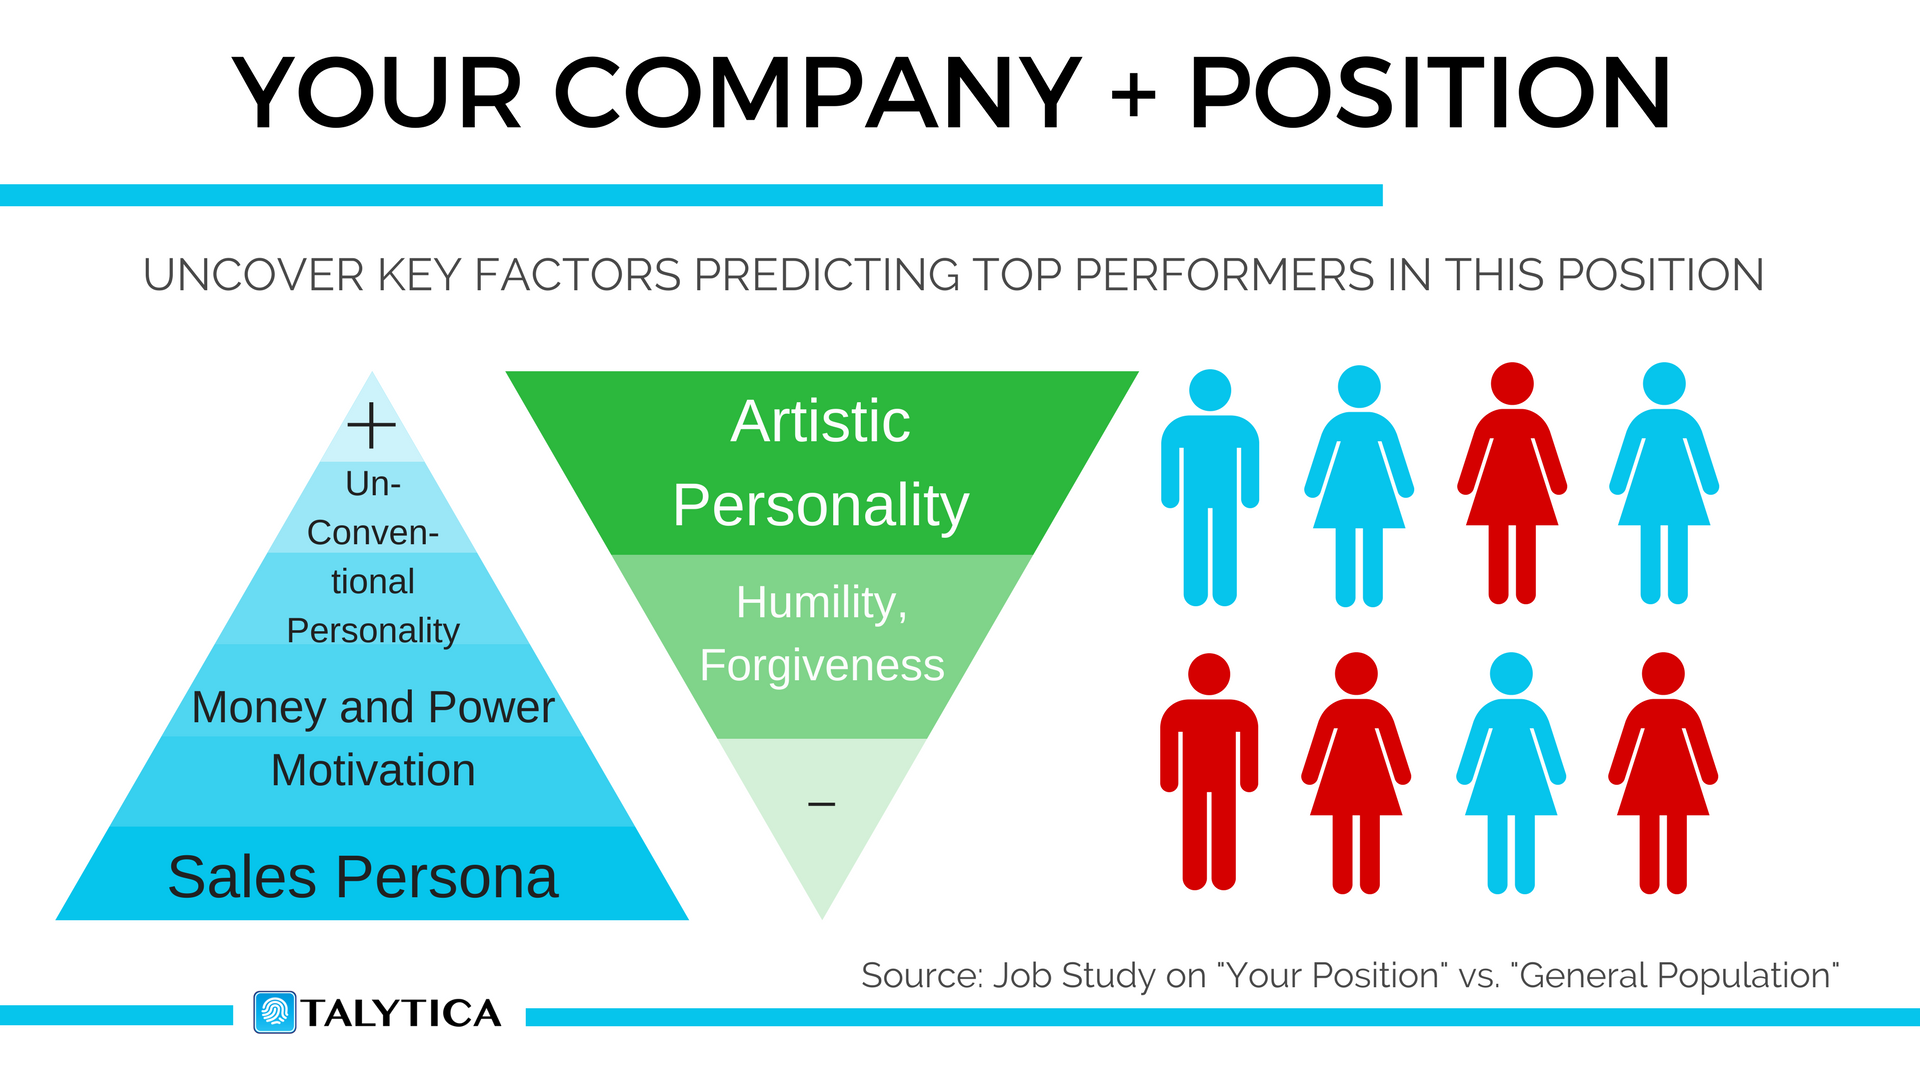
WHEN & WHERE IS TURNOVER OCCURRING
There are many stages to an ideal typical employee lifecycle. It is important to understand where, when and why within this lifecycle turnover is occurring. This can be done with surveys, interviews and analytics. Ask yourself, are you doing all you can to find the best-fit employees, to on-board them in the best possible way, to mentor and to train them – including sharing best practices and exposing them to ‘exemplary’ workers, to incentivize and manage them in an optimal and fair way, to promote and re-recruit them as their skill-sets and abilities grow, and finally to re-mentor and re-train them for any new positions.
At many of the companies we have worked with, employee ramp-up can take 18 months or more for an employee to reach full productivity. This is true even at positions we may not think of initially as complex, such as Sales Agents.
When you truly understand the costs of employee turnover and your employee turnover rate, we believe that you will find this makes both economic and common sense. Your existing workers get your company. They have relationships and organizational know-how. It’s expensive to lose them.
HOW DOES EMPLOYEE TURNOVER IMPACT BUSINESSES
Everyone knows or senses that turnover hurts their organization, especially senior managers and overworked HR teams. But, without deep inspection, few truly appreciate just how costly it can be. There are four main sub-dimensions to the all-in costs of employee turnover.
- THE REPLACEMENT COST OF EMPLOYEE TURNOVER
- LOST PRODUCTIVITY AS NEW HIRES RAMP UP AND OTHERS COVER FOR THEM
- THE CULTURAL IMPACTS OF HIGH TURNOVER, INCLUDING A LOST SENSE OF TEAM AND SHARED VALUES
- THE MANAGEMENT, SYSTEMS & HR STRAIN FROM HIGH TURNOVER
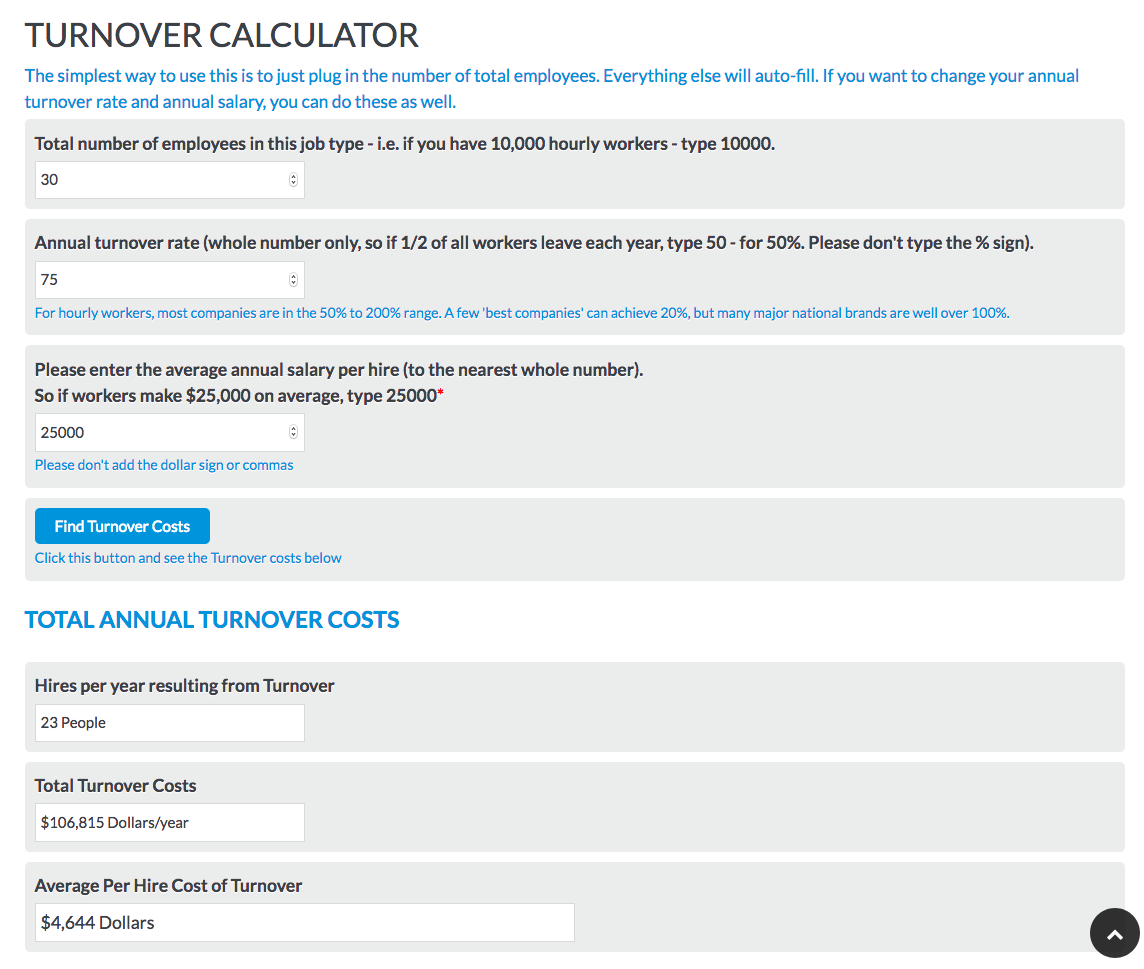
As far as the replacement costs of turnover, we have created an ’employee turnover cost’ calculator that can be found here.
Some simple analysis for a small, 30 person business hiring hourly workers is presented below. This is only considering the replacement and on-boarding of workers, not the cultural impacts or system strain. The reality is that turnover is likely costing this business over $100,000 each year. A 10% reduction in turnover, would therefore save them $10,000 – and a 30% reduction would save over $30, 000. Every year.
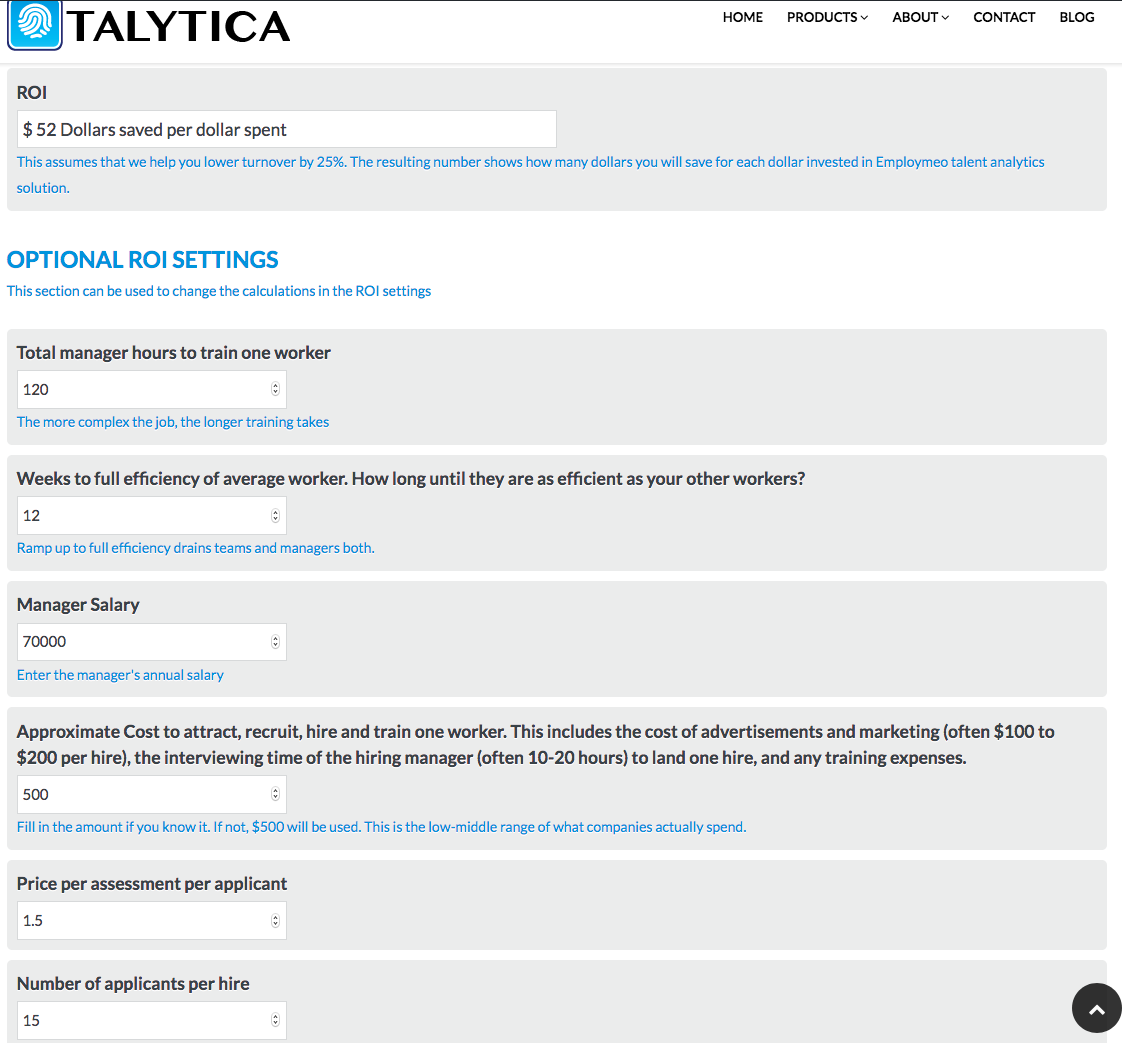
Let’s look at the Return on Investment (or ROI) of any measures that improve the hiring efficiency. If we do, what we see is that they have very impressive ROI’s indeed. Measures to improve selection can be fast and easy, with huge returns.
For example, what happens if we take this same 30 person restaurant with fairly modest assumptions on the real costs of worker replacement, and then assume we find a way to reduce turnover that costs us, on average $1.5/applicant, to do.
Now, let’s imagine a position where the training and on-boarding costs are much higher, as well as the ramp up to full productivity. This is common for ‘higher complexity’ jobs, and we have seen these patterns with a wide-range of clients. Examples include nursing and doctors, salespeople selling higher priced items, and many knowledge workers. What does our turnover calculator show in these situations?
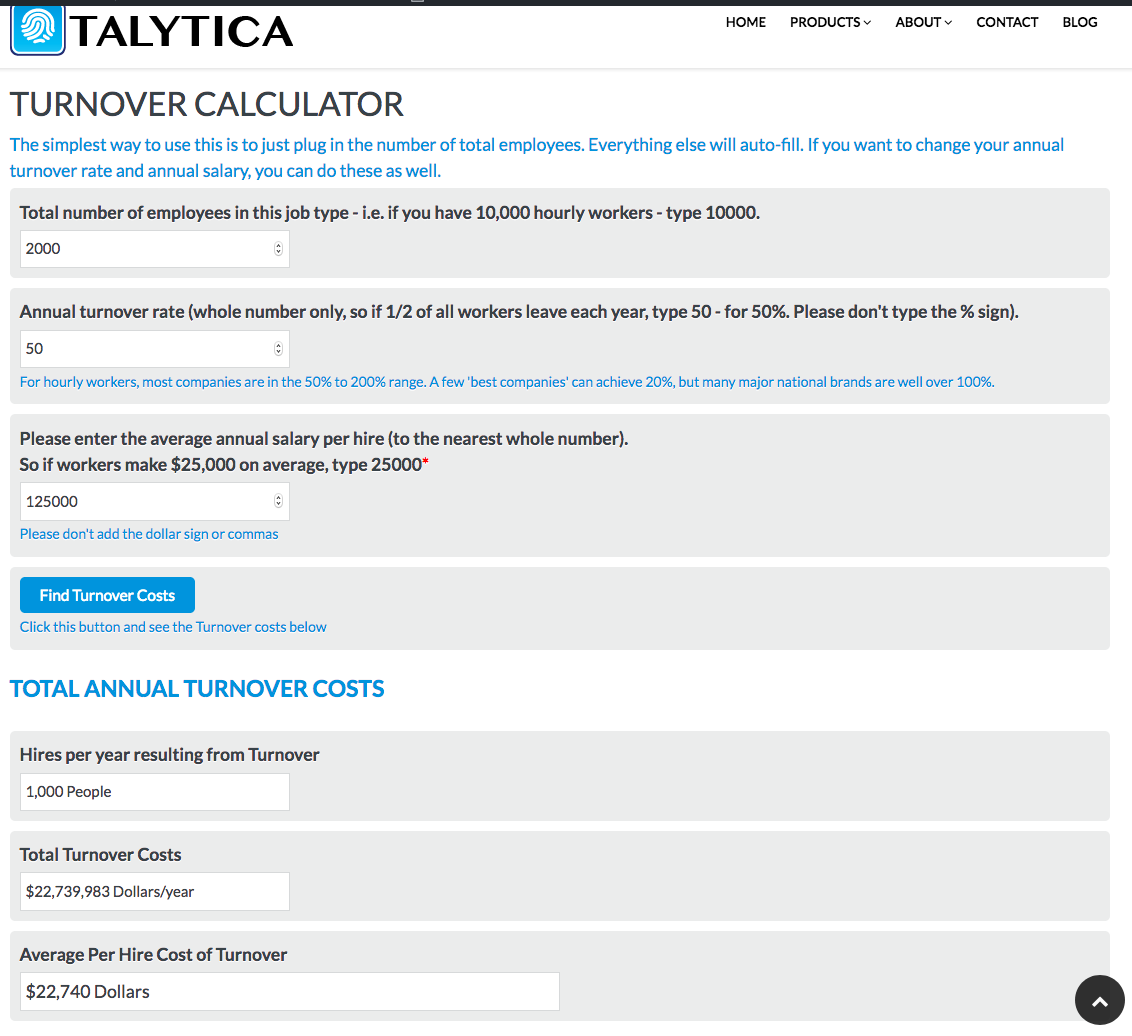
So, this company will be spending over $22 Million dollars each year just replacing workers. These numbers are actually most likely on the low-side, as a majority of studies show that organizations frequently pay between 25% and 33% of a workers annual salary to replace them. Most of these studies don’t look at true second order effects, such as ‘culture impacts’ and brand equity as these are very hard to measure.
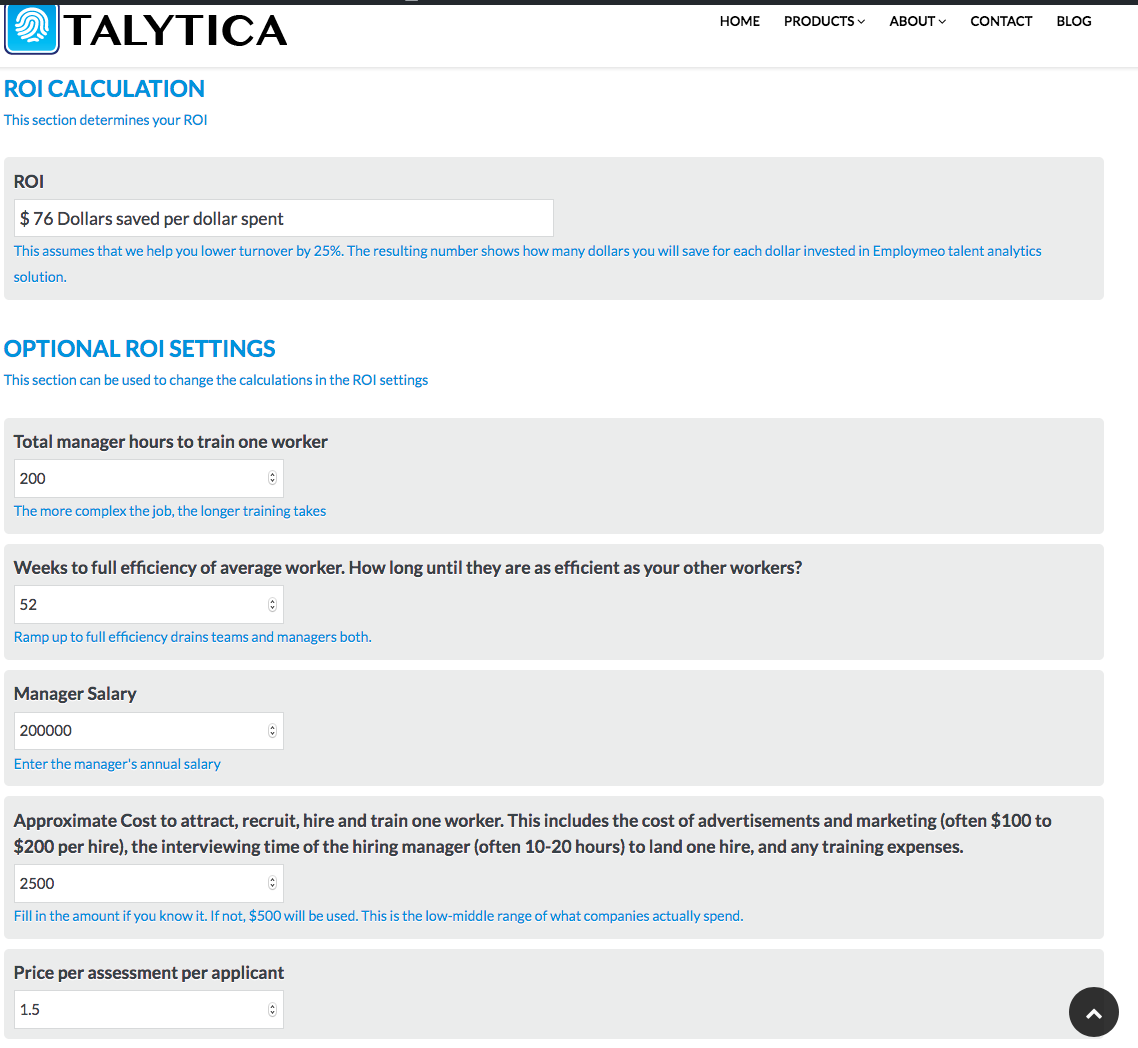
For this hypothetical 1,000 person company, what would the ROI be of a solution that cost $1.50 per applicant, but drove down turnover by 25%?
Again, the numbers are large – but they are supported by every study we have found, as well as by common sense. This company would, in this case have an ROI over 70X. It would be a ‘no-brainer’ investment for HR and senior management.
WILL YOU LOSE CANDIDATES WITH A TOUGHER HIRING PROCESS
No. Okay, it is possible – but not that likely. The overwhelming majority of research shows that you will not lose candidates with a tougher hiring process. In fact, research from Glassdoor shows that the tougher the hiring process – generally speaking, the better. With the 4 out of 5 on the difficulty scale appearing optimal. What’s more –
- A 10% more difficult job interview process is associated with 2.6% higher employee satisfaction later on. (Source 1)
- Organizations that invest in a strong candidate experience improve their quality of hires by 70%. (Source 1)
Overall, candidates especially millenials, prefer organizations that have a higher bar for admission. They like being part of companies that invest in selection, on-boarding and training – and maintain strong benefits and an engage corporate culture.
AUTOMATED HIRING SOLUTIONS
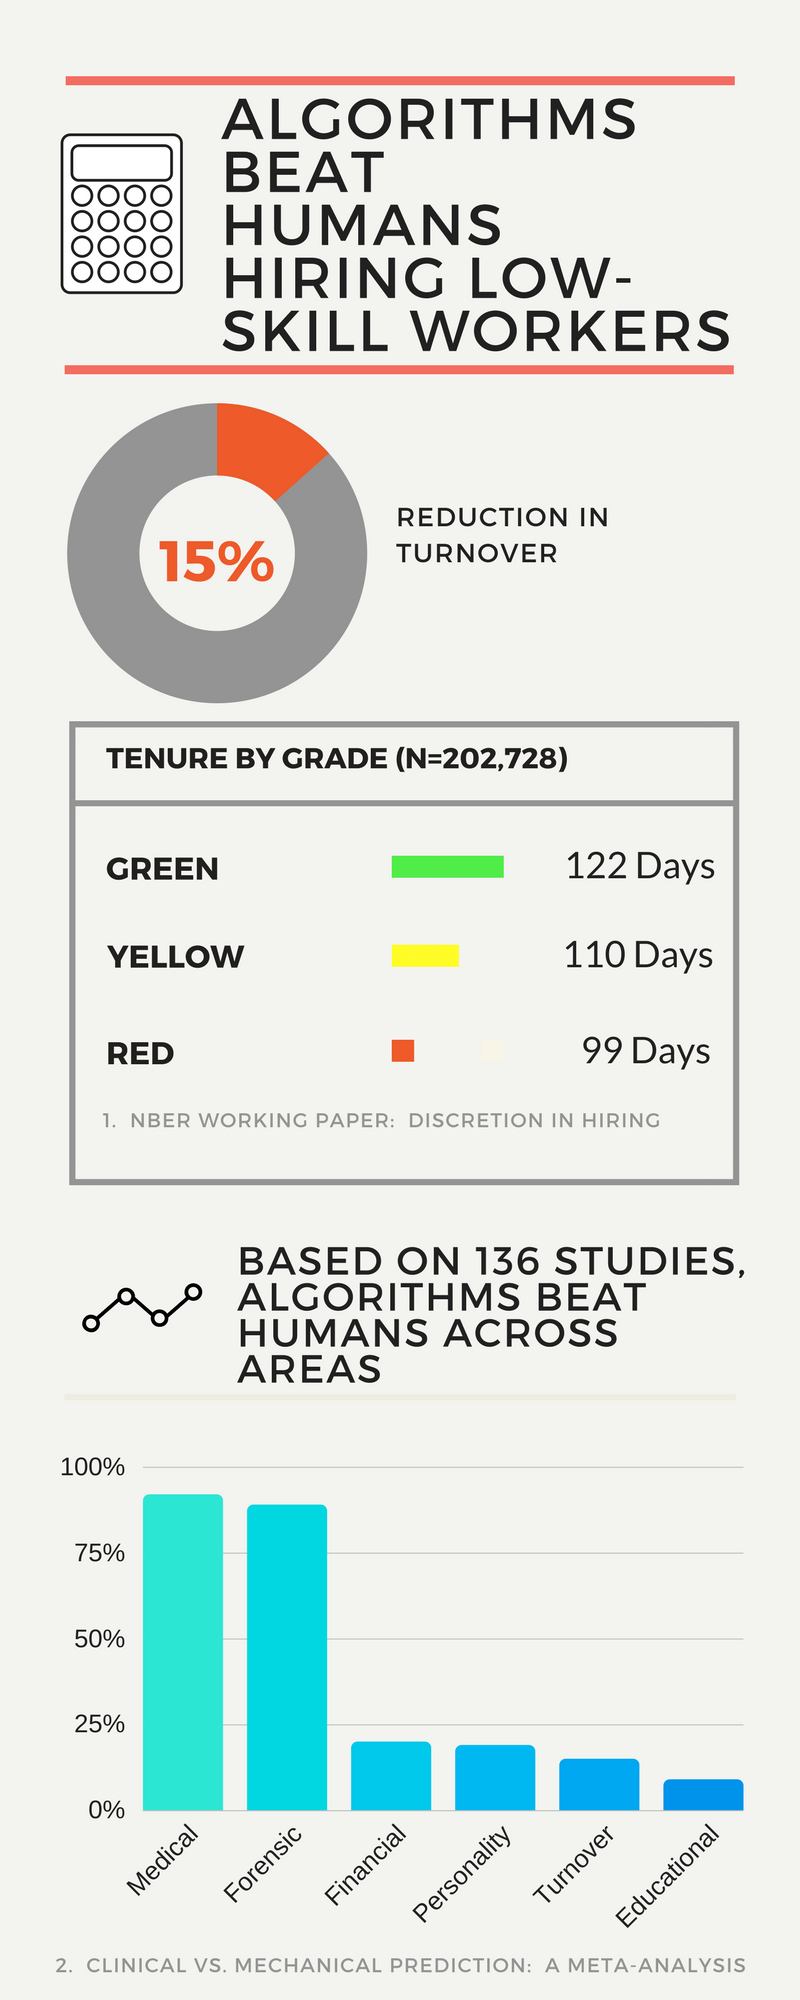
In one of the largest and most thorough studies on employee turnover, and the cost of employee turnover, the National Bureau of Economic Research (NBER) (source 4) found that simple automated ‘models’ significantly beat humans in hiring hourly workers. When humans overruled models, the average performance of those candidates hired got worse. We are not advocating for replacing humans. We believe that humans armed with the best tools, data and models will make the best decisions in the long haul. But, the research is large, peer-reviewed and conclusive. This finding is not limited to hiring.
This was a study looking at 15 firms, over 250,000 employees and
A large met-study of over 136 peer-reviewed papers showed that algorithms almost uniformly beat or tied humans across a wide variety of industries and problems.
HOW TALYTICA CAN HELP & WHAT CAN BE DONE TO SOLVE EMPLOYEE TURNOVER
There is no one silver, magic bullet. The best approach is to create an intelligent, well-designed multi-facet process – and then to collect data and have a systematic way for monitoring the outcomes of your process and ways for continual process upgrades. To give you a sense of the facets we measure at Talytica, they include the following.
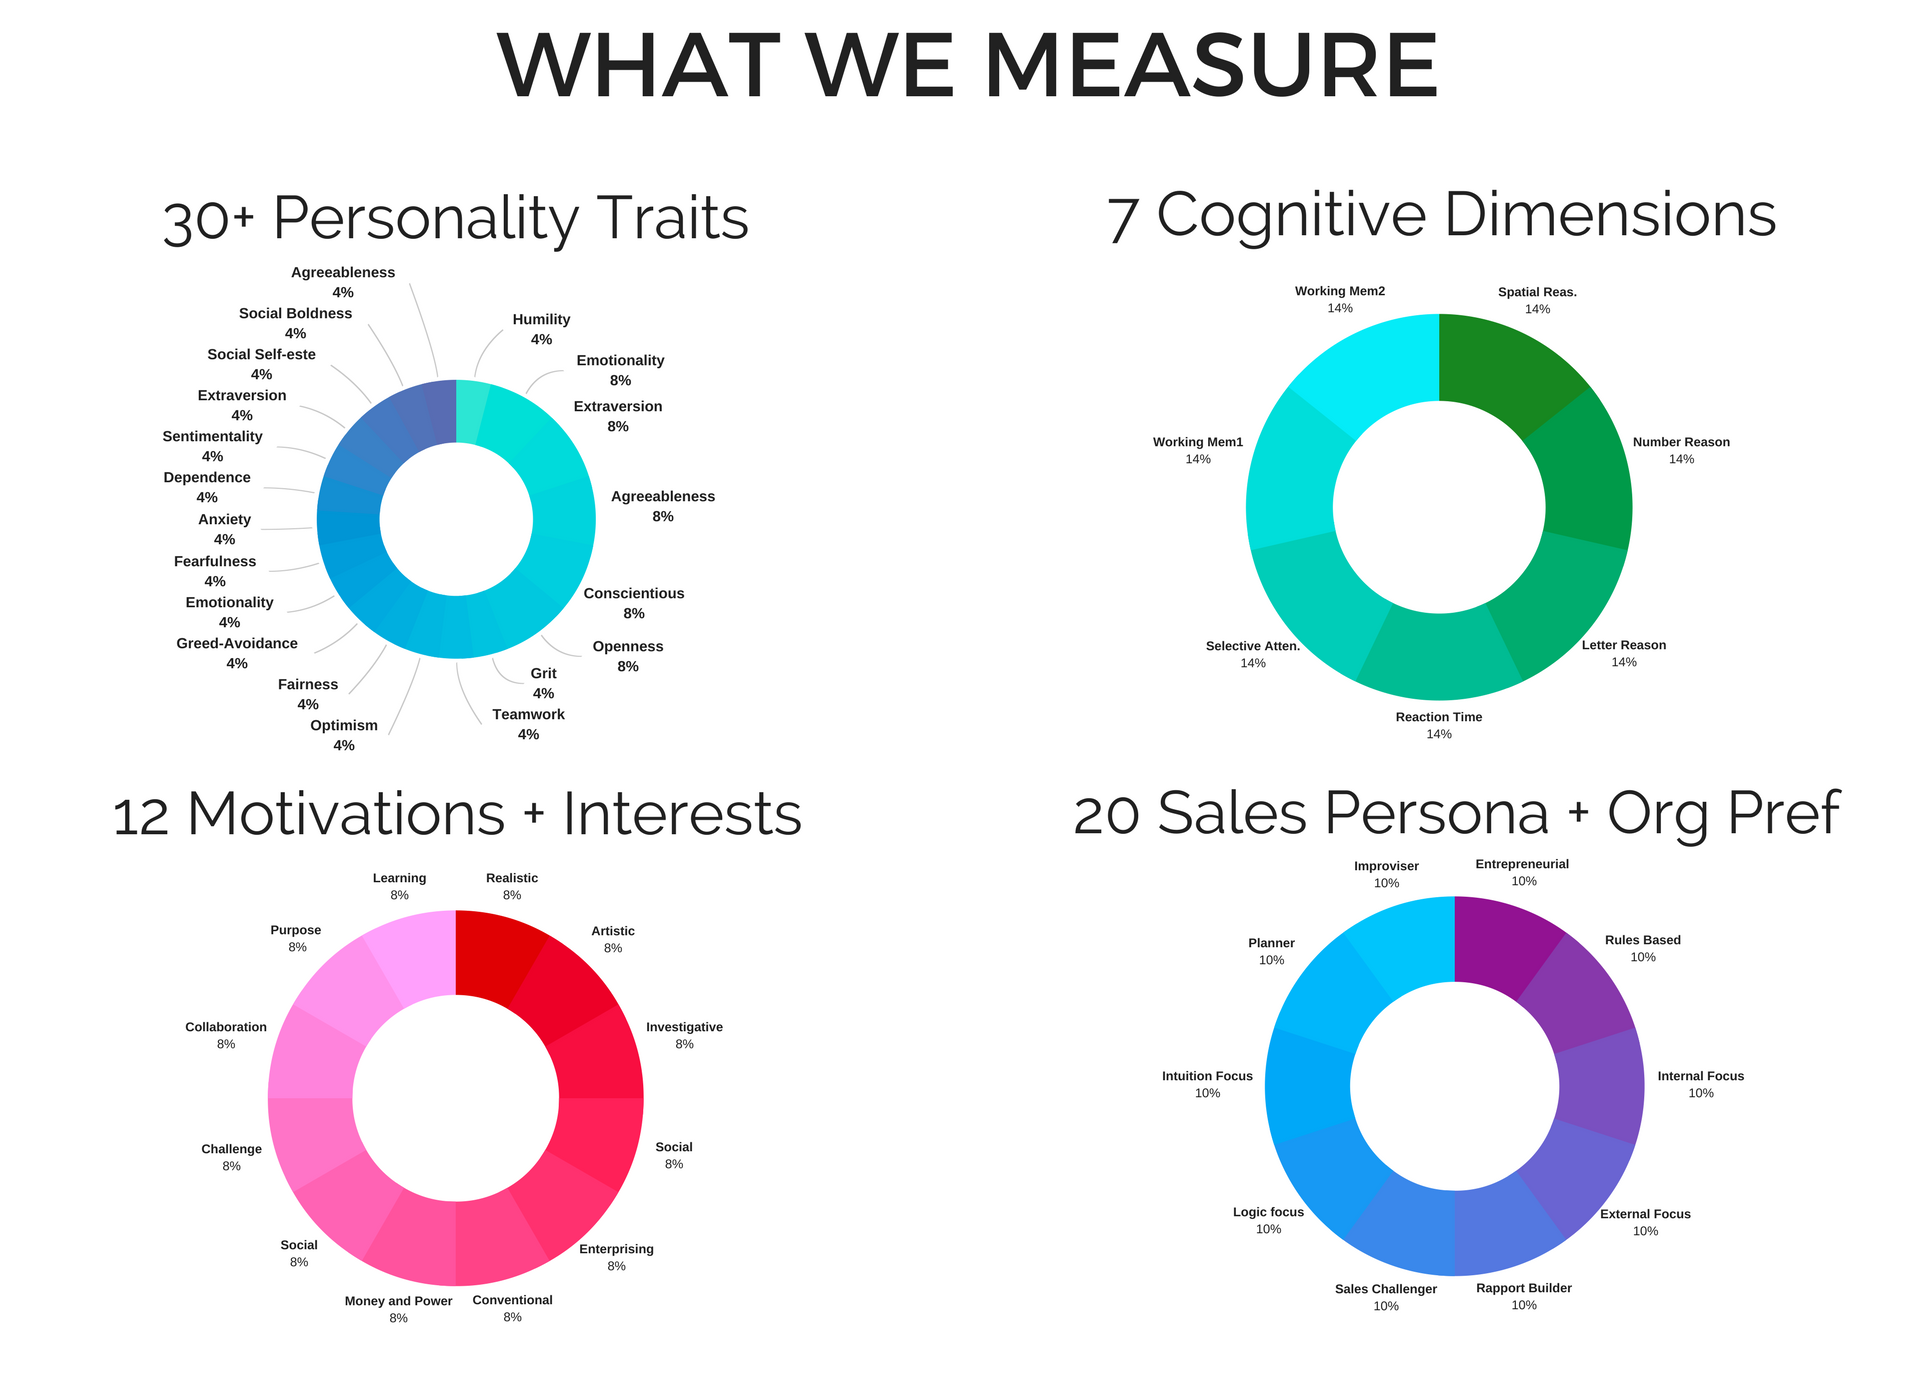
We also perform a full range of text analytics, and Natural language processing – and can collect data through surveys, open text responses, audio interviews, video interviews, scored human raters / graders and reference checks.
We believe that there is no one perfect way to assess a person, but all methods should be subject to measurement and validation.
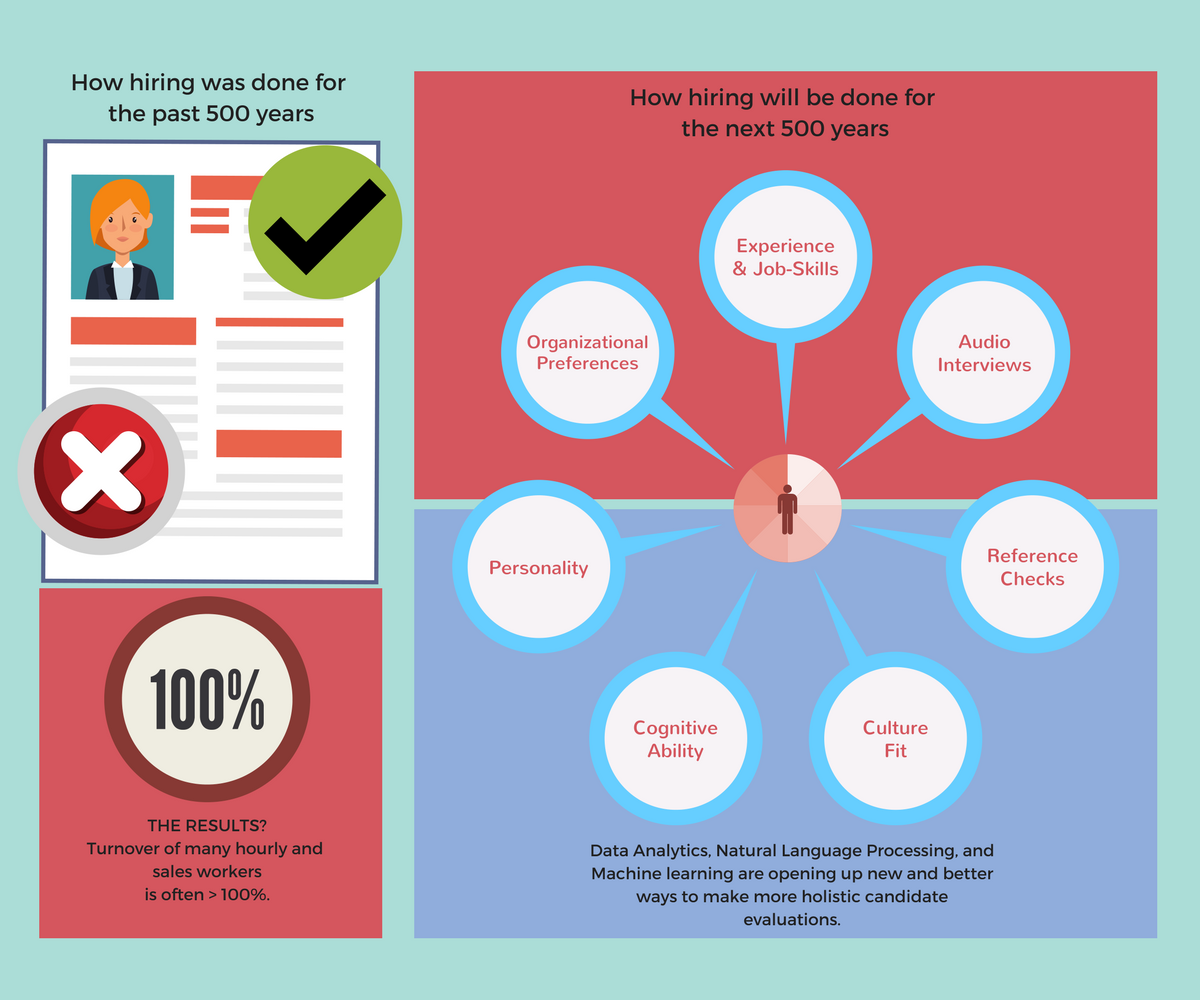
We have a comprehensive, diversified set of talent analytics and a powerful back-end machine learning engine. This unique combination allows us to build custom models and solutions at scale. We can integrate assessments, job specific questions, audio interviews with automated emotion detection and human scoring, automated reference checks and text and language analytics. The sum of these pieces is often much greater than the parts. The result is better hiring, and a better understanding of what is driving employee turnover and how to reduce employee turnover costs.
We would be happy to do a full, in-depth study of your organization, and let you know how we can help. Just contact us.
SOURCES
- resources.glassdoor.com/rs/899-LOT-464/images/50hr-recruiting-stats-2017
- www.nber.org/papers/w12976
- Holom, B., Mitchell, T., Lee, T., & Eberly, M (2008). Turnover and Retention Research: A Glance at the Past, a Closer Review of the Present, and a Venture into the Future.
- Hoffman, M., Kahn, L.B., & Li, D. (2015). Discretion in Hiring (Working Paper No. 21709). Retrieved from National Bureau of Economic Research website: http://www.nber.org/papers/w21709
- www.gallup.com/businessjournal/166667/five-ways-improve-employee-engagement.aspx
- Pinpoint Market research and Arthur Jones. www.businessnewsdaily/8194/benefits-millennials-want.html.
- “The Middle Skills Gap.” A research report by the ATS Icims.